ORIGIN AI®
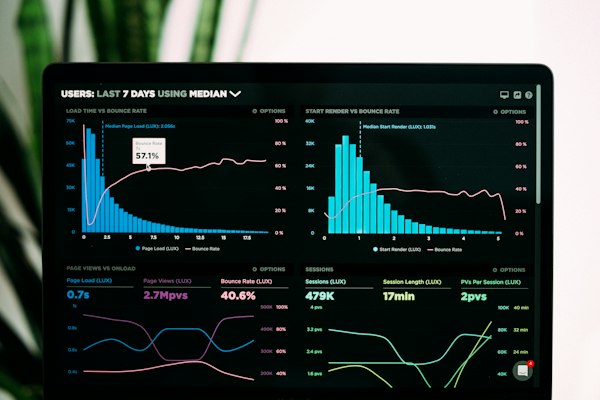
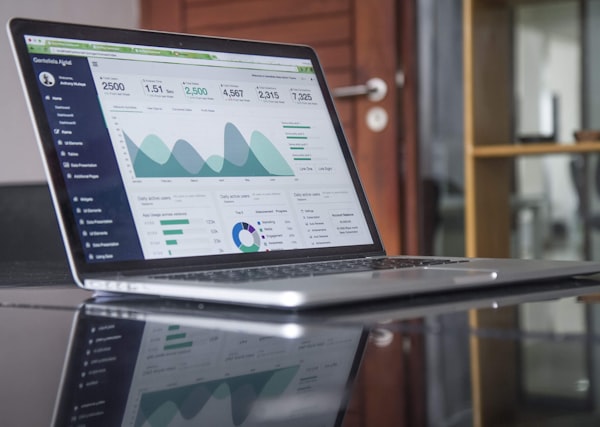
We transform raw numbers into interactive dashboards and BI reports that executives actually use. PowerBI, Tableau, and Excel — built for your team, your data, your decisions.
Power BI is the industry standard for enterprise business intelligence. We build semantic models, custom DAX measures, Row-Level Security, and paginated reports that integrate with your entire Microsoft 365 ecosystem.
Tableau is the gold standard for visual data storytelling. We design pixel-perfect Tableau workbooks with custom LOD calculations, table calculations, and Tableau Prep Builder pipelines — built for analysts who need to explore, not just report.
Every organisation has mission-critical Excel workbooks that "just work." We automate, optimise, and extend them — VBA macros, Power Query transforms, dynamic arrays, and custom functions that eliminate manual work without replacing the tool your team knows.
C-suite dashboards that surface the 5–10 metrics that matter most — revenue, margin, pipeline, churn, and ops health — in a single view. Designed for speed: loaded in under 3 seconds, readable in under 10.
Pipeline tracking, conversion funnel analysis, rep performance leaderboards, quota attainment, and win/loss breakdowns. Connected to your CRM in real-time so sales managers stop waiting for Monday morning reports.
Automated P&L, balance sheet, and cash flow dashboards with variance analysis, budget vs actual comparisons, and rolling forecasts. Replace weekly Excel emails with a live report your CFO can trust.
Real-time inventory, throughput, OEE, defect rates, supplier scorecards, and logistics tracking. Built for ops managers who need to act on data, not analyse it — every chart has a clear call-to-action threshold.
 Retail / E-commerce
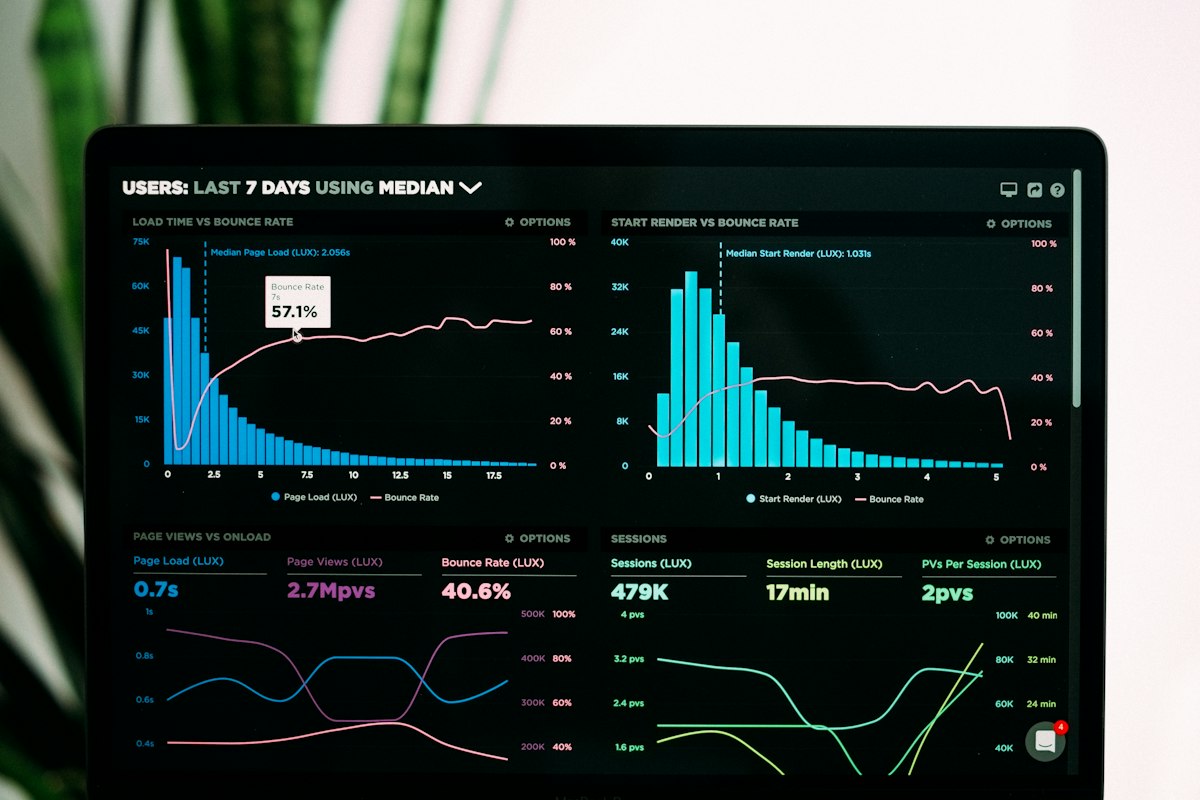
Real-time Power BI dashboard consolidating 12 data sources (Shopify, Amazon, SAP, Google Analytics, loyalty CRM) into a single executive view. Tracks 80+ KPIs across online, in-store, and wholesale channels with automated daily email snapshots to leadership.
 Finance
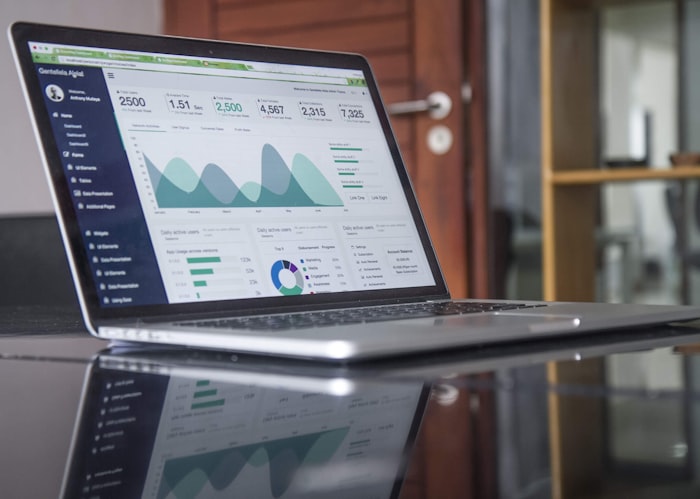
Tableau workbook replacing 14 separate Excel reports. Live P&L, cashflow, EBITDA, and variance dashboards with 3-year rolling forecasts. Reduced monthly close reporting from 3 days to 4 hours.
 Healthcare
Real-time bed occupancy, staff utilisation, wait times, and readmission tracking for a 500-bed hospital. Row-Level Security ensures doctors see only their ward data.
 Manufacturing
Automated Excel-based shift reports via VBA feeding a live Power BI OEE dashboard. Downtime classification, defect Pareto charts, and SPC control charts for quality team.
 HR & People Analytics
Headcount, attrition, diversity, time-to-hire, and engagement score tracking across 2,000 employees in 12 countries. LOD expressions for cohort analysis and benchmarking.
Tell us your data sources, your audience, and the decisions you need to make faster. We'll design a dashboard that earns its place on your screen every day.